
Most Dangerous US States for Driving
Texas takes the top spot as the most dangerous state for driving, as research reveals over 3,000 fatal car accidents
If you’re planning on taking a road trip any time soon, it may be wise to take a look at the list below to keep you and your passengers as safe as you can be, wherever you may be headed. Here at Uplift Legal Funding, we conducted research to reveal the most and least dangerous states to drive in, based on car accident data.
Speed state Texas, unfortunately, takes the top spot, with 3,305 fatal crashes recorded in 2018, possibly a result of their whopping 85mph speed limit*. At the other end of the list is Rhode Island, which boasts just 56 fatal crashes in 2018, with just 7 accidents occurring on the state’s most dangerous road, the I-295 S, between 2015-2017**.
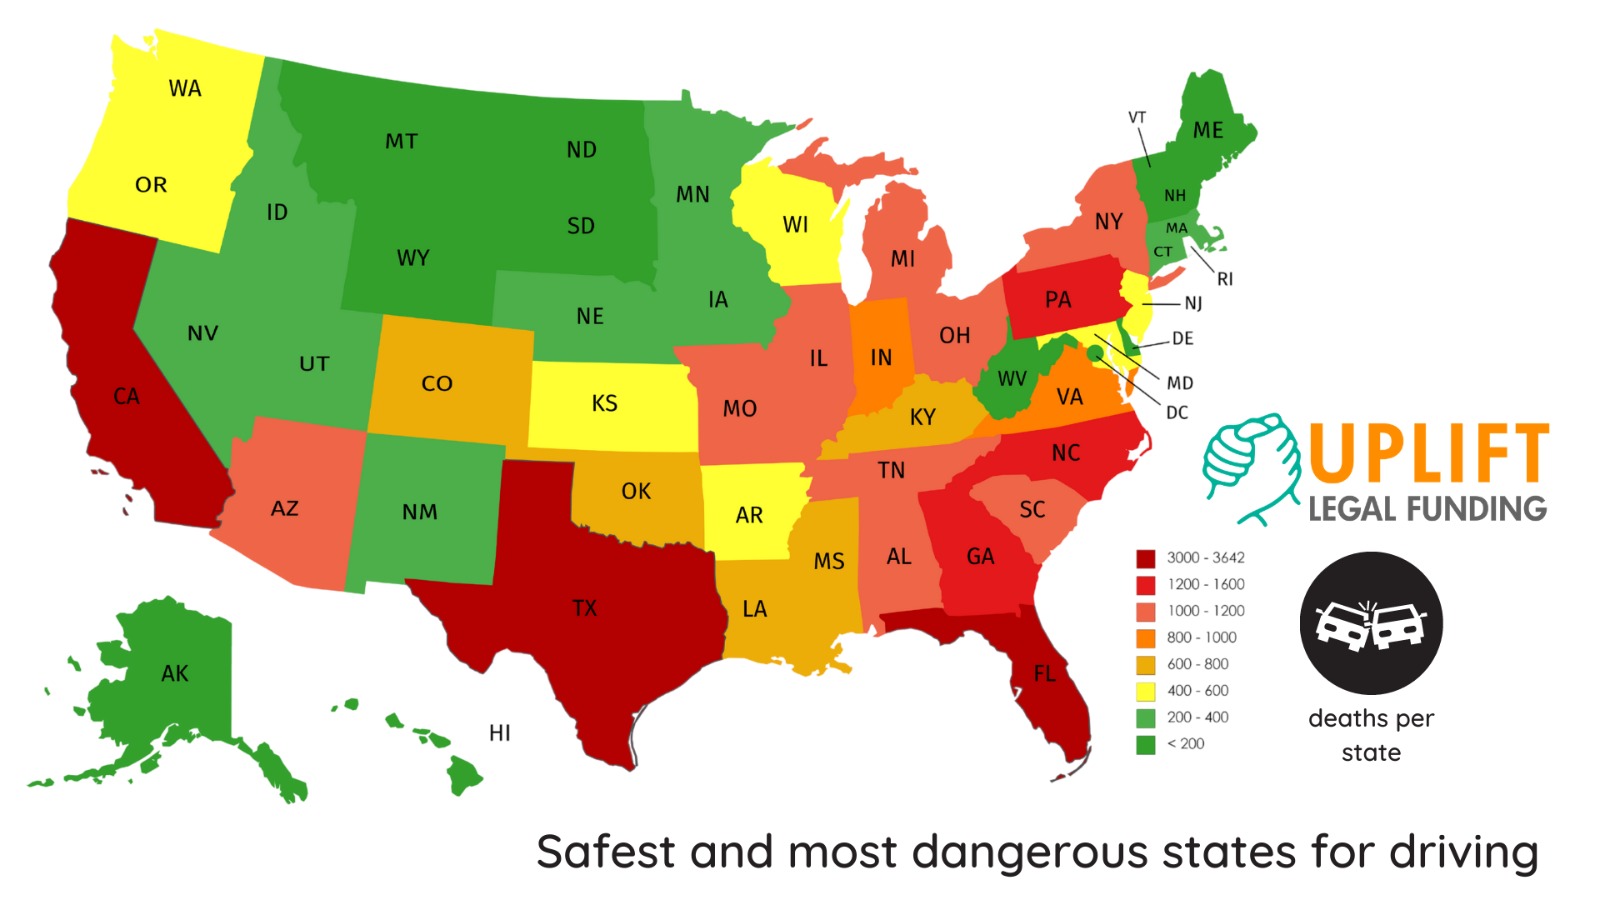
| State | Traffic fatalities (2018) |
|---|---|
| Texas | 3,642 |
| California | 3,563 |
| Florida | 3,133 |
| Georgia | 1,504 |
| North Carolina | 1,437 |
| Pennsylvania | 1,190 |
| Ohio | 1,068 |
| Tennessee | 1,041 |
| South Carolina | 1,037 |
| Illinois | 1,031 |
| Arizona | 1,010 |
| Michigan | 974 |
| Alabama | 953 |
| New York | 943 |
| Missouri | 921 |
| Indiana | 858 |
| Virginia | 820 |
| Louisiana | 768 |
| Kentucky | 724 |
| Mississippi | 664 |
| Oklahoma | 655 |
| Colorado | 632 |
| Wisconsin | 588 |
| New Jersey | 564 |
| Washington | 546 |
| Arkansas | 516 |
| Oregon | 506 |
| Maryland | 501 |
| Kansas | 404 |
| New Mexico | 391 |
| Minnesota | 381 |
| Massachusetts | 360 |
| Nevada | 330 |
| Iowa | 318 |
| Connecticut | 294 |
| West Virginia | 294 |
| Utah | 260 |
| Idaho | 231 |
| Nebraska | 230 |
| Montana | 182 |
| New Hampshire | 147 |
| Maine | 137 |
| South Dakota | 130 |
| Hawaii | 117 |
| Delaware | 111 |
| Wyoming | 111 |
| North Dakota | 105 |
| Alaska | 80 |
| Vermont | 68 |
| Rhode Island | 59 |
| District of Columbia | 31 |
Source: NHTSA, Fatality Analysis Reporting System (FARS), 2018 State Traffic Data (DOT HS 812 948). Excludes Puerto Rico (308).
Aside from the well-known 85mph speed limit, Texas is home to the treacherous I-45***. Not only is it the most dangerous road in Texas but is the second most dangerous road in the US. Harris County saw the most fatalities along the intersection, with 115 deaths in a one-year period.
Despite a high population of 12,741,080, Illinois boasts a surprisingly low number of fatal crashes, recording 948 in 2018. Comparing that with 1,103 in Pennsylvania (a population of 12,807,060), it is interesting that The Land of Lincoln doesn’t sit higher in the top 10.
Wyoming, with the lowest population size on the list (577,737), sits fifth from the bottom recording 100 fatal crashes in 2018, resulting in 19.2 deaths per 100,000 people – almost double the number of fatal crashes in Rhode Island (56) – which has double the population size.
Other factors were taken into account when conducting the research, for example, almost half (45%) of the victims involved in fatal crashes in Montana had a BAC (blood alcohol content) of 0.08 or higher, compared to just 12% in West Virginia.
Additionally, despite having the highest number of fatal crashes, Texas has an observed seatbelt use of 90%. The state with the highest observed front seat seat belt use in 2018 was Hawaii, at 98%, while the lowest was New Hampshire at 76%.
We also looked into the deaths per capita for each of these states, you can see the results below, as well as the list of most dangerous and safest states for driving.
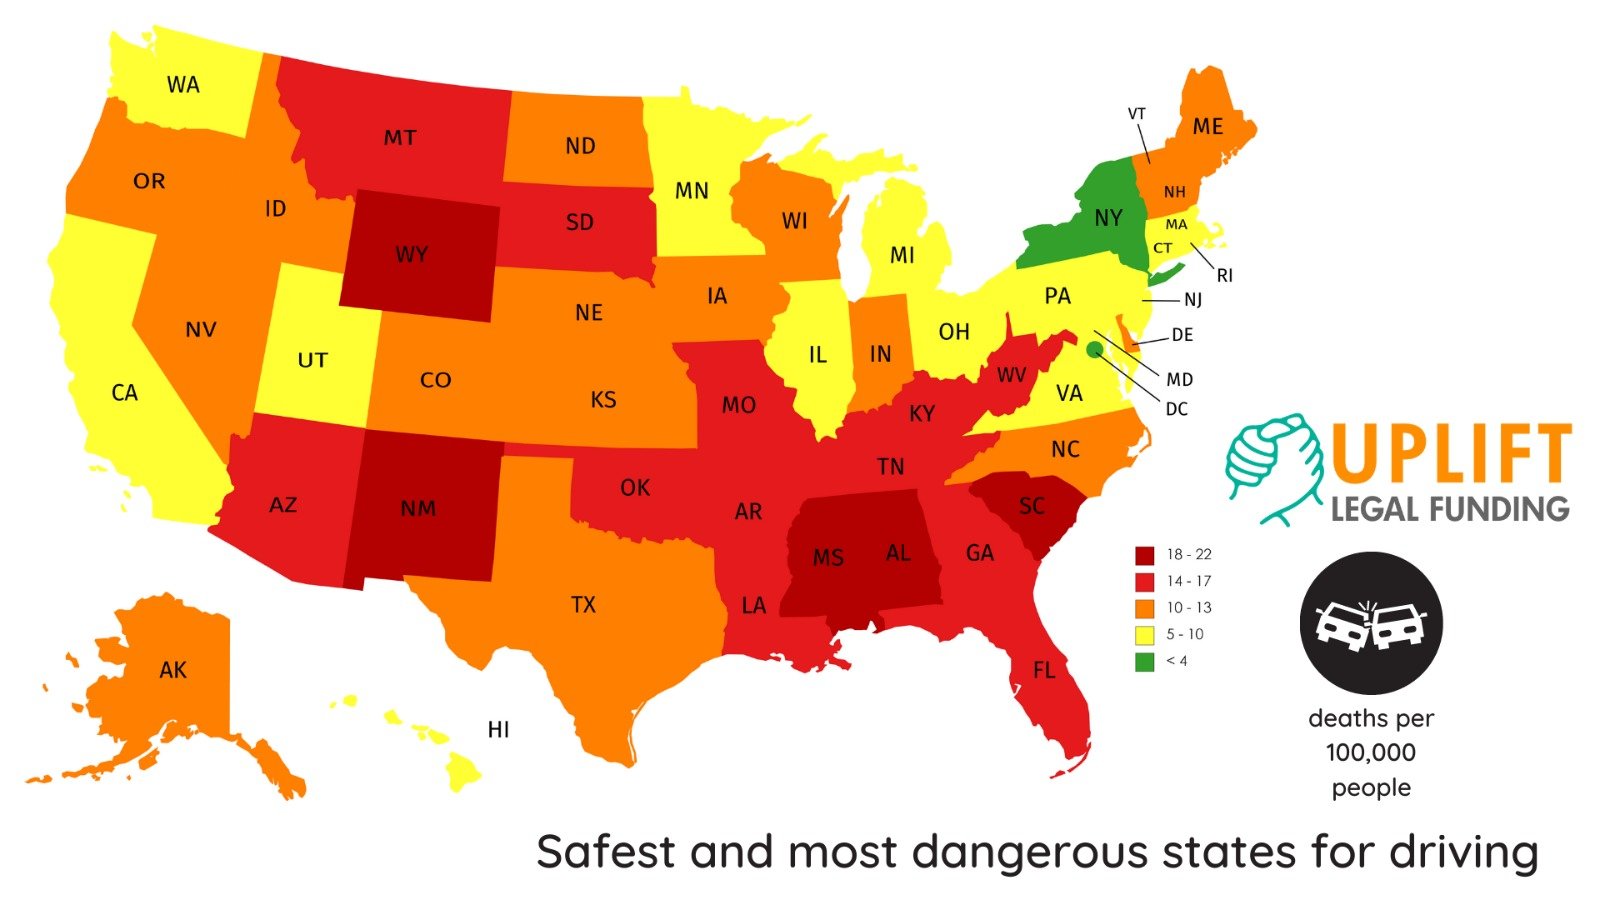
| State | Traffic fatalities | Population (thousands) | Deaths per 100,000 |
|---|---|---|---|
| Mississippi | 664 | 2,987 | 22.23 |
| South Carolina | 1,037 | 5,084 | 20.40 |
| Alabama | 953 | 4,888 | 19.50 |
| Wyoming | 111 | 578 | 19.21 |
| New Mexico | 391 | 2,095 | 18.66 |
| Montana | 182 | 1,062 | 17.13 |
| Arkansas | 516 | 3,014 | 17.12 |
| Oklahoma | 655 | 3,943 | 16.61 |
| Louisiana | 768 | 4,660 | 16.48 |
| West Virginia | 294 | 1,806 | 16.28 |
| Kentucky | 724 | 4,468 | 16.20 |
| Tennessee | 1,041 | 6,770 | 15.38 |
| Missouri | 921 | 6,126 | 15.03 |
| South Dakota | 130 | 882 | 14.74 |
| Florida | 3,133 | 21,299 | 14.71 |
| Georgia | 1,504 | 10,519 | 14.30 |
| Arizona | 1,010 | 7,172 | 14.08 |
| Kansas | 404 | 2,912 | 13.88 |
| North Carolina | 1,437 | 10,384 | 13.84 |
| North Dakota | 105 | 760 | 13.81 |
| Idaho | 231 | 1,754 | 13.17 |
| Indiana | 858 | 6,692 | 12.82 |
| Texas | 3,642 | 28,702 | 12.69 |
| Oregon | 506 | 4,191 | 12.07 |
| Nebraska | 230 | 1,929 | 11.92 |
| Delaware | 111 | 967 | 11.48 |
| Colorado | 632 | 5,696 | 11.10 |
| Nevada | 330 | 3,034 | 10.88 |
| Vermont | 68 | 626 | 10.86 |
| Alaska | 80 | 737 | 10.85 |
| New Hampshire | 147 | 1,356 | 10.84 |
| Maine | 137 | 1,338 | 10.24 |
| Wisconsin | 588 | 5,814 | 10.11 |
| Iowa | 318 | 3,156 | 10.08 |
| Michigan | 974 | 9,996 | 9.74 |
| Virginia | 820 | 8,518 | 9.63 |
| Pennsylvania | 1,190 | 12,807 | 9.29 |
| Ohio | 1,068 | 11,689 | 9.14 |
| California | 3,563 | 39,557 | 9.01 |
| Maryland | 501 | 6,043 | 8.29 |
| Hawaii | 117 | 1,420 | 8.24 |
| Connecticut | 294 | 3,573 | 8.23 |
| Utah | 260 | 3,161 | 8.22 |
| Illinois | 1,031 | 12,741 | 8.09 |
| Washington | 546 | 7,536 | 7.25 |
| Minnesota | 381 | 5,611 | 6.79 |
| New Jersey | 564 | 8,909 | 6.33 |
| Rhode Island | 59 | 1,057 | 5.58 |
| Massachusetts | 360 | 6,902 | 5.22 |
| New York | 943 | 19,542 | 4.83 |
| District of Columbia | 31 | 702 | 4.41 |
| U.S. total | 36,560 | 327,167 | 11.17 |
Source: NHTSA, Fatality Analysis Reporting System (FARS), 2018 State Traffic Data (DOT HS 812 948), Table 1. U.S. total excludes Puerto Rico (308 fatalities; 9.64 per 100,000).
Most Dangerous States
- Texas – 3,305 fatal crashes, 3,642 deaths
- California – 3,259 fatal crashes, 3,563 deaths
- Florida – 2,915 fatal crashes, 3,133 deaths
- Georgia – 1,407 fatal crashes, 1,504 deaths
- North Carolina – 1,321 fatal crashes, 1,437 deaths
- Pennsylvania – 1,103 fatal crashes, 1,190 deaths
- Ohio – 996 fatal crashes, 1,068 deaths
- Tennessee – 974 fatal crashes, 1,041 deaths
- South Carolina – 970 fatal crashes, 1,037 deaths
- Illinois – 948 fatal crashes, 1,031 deaths
Least Dangerous States
- New Hampshire – 134 fatal crashes, 147 deaths
- Maine – 128 fatal crashes, 137 deaths
- South Dakota – 110 fatal crashes, 130 deaths
- Hawaii – 110 fatal crashes, 117 deaths
- Delaware – 104 fatal crashes, 111 deaths
- Wyoming – 100 fatal crashes, 111 deaths
- North Dakota – 95 fatal crashes, 105 deaths
- Alaska – 69 fatal crashes, 80 deaths
- Vermont – 60 fatal crashes, 68 deaths
- Rhode Island – 56 fatal crashes, 59 deaths
Jared Stern, the owner of Uplift Legal Funding, said,
“Now more than ever people are using their own vehicles rather than using public in a bid to minimize interaction with others and stay safe from COVID-19. However, we at Uplift Legal Funding realize that using a car will not keep you 100% out of harm’s way, that is why we created this list.
“Car crashes can be devastating for victims and their families, even when they aren’t fatal. We feel that it is important that residents and visitors understand the seriousness of driving, even on roads they have driven every day of their lives, to try and keep everyone as safe as possible.”
All fatal crash, death, BAC, and seat belt usage data sourced from https://www.iihs.org/topics/fatality-statistics/detail/state-by-state#restraint-use
*https://www.iihs.org/topics/speed/speed-limit-laws
**https://www.asecurelife.com/most-dangerous-us-highways-for-summer/
***https://www.herrmanandherrman.com/car-accident-lawyers/most-dangerous-roads-in-texas/#:~:text=I%2D45%20is%20the%20most,by%20the%20Accident%20Data%20Center
Uplift Legal Funding
Uplift Legal Funding is a US-based legal funding company that specializes in pre-settlement loans for car accident claims.