Car Accident Trends and Statistics

Key Takeaways

  • U.S. traffic fatalities dropped by 3.6% from 42,514 in 2022 to 40,990 in 2023.
  • Children and teens are shockingly almost twice as likely to die in car accidents than young adults aged 19-25.
  • Car accidents hit a yearly high in October despite the summer months usually being the busiest on the roads.
  • Approximately 17% of car accidents happen on Saturday.
  • According to recent accident data, men were approximately 150% more likely to die in motor vehicle crashes than women.
  • Twenty-three percent of passenger vehicle occupants killed in 2021 were younger than 25, a trend that continues in years following.
  • Traditionally, smaller and lighter vehicles have seen higher rates of driver fatalities per million registered models. 
  • Around 28.71% of traffic deaths were related to speeding, and trends seem to be climbing.
  • Drunk driving remains a deadly gamble on our roads, with a staggering 14% jump in fatalities —a preventable crisis starkly illustrated by nearly two decades of alcohol-impaired driving trends.

Most Dangerous States to Drive In Based on Car Accident Fatalities

The year 2023 has presented a mixed landscape regarding road safety across the United States.

Overview of Traffic Fatality Risk in 2023

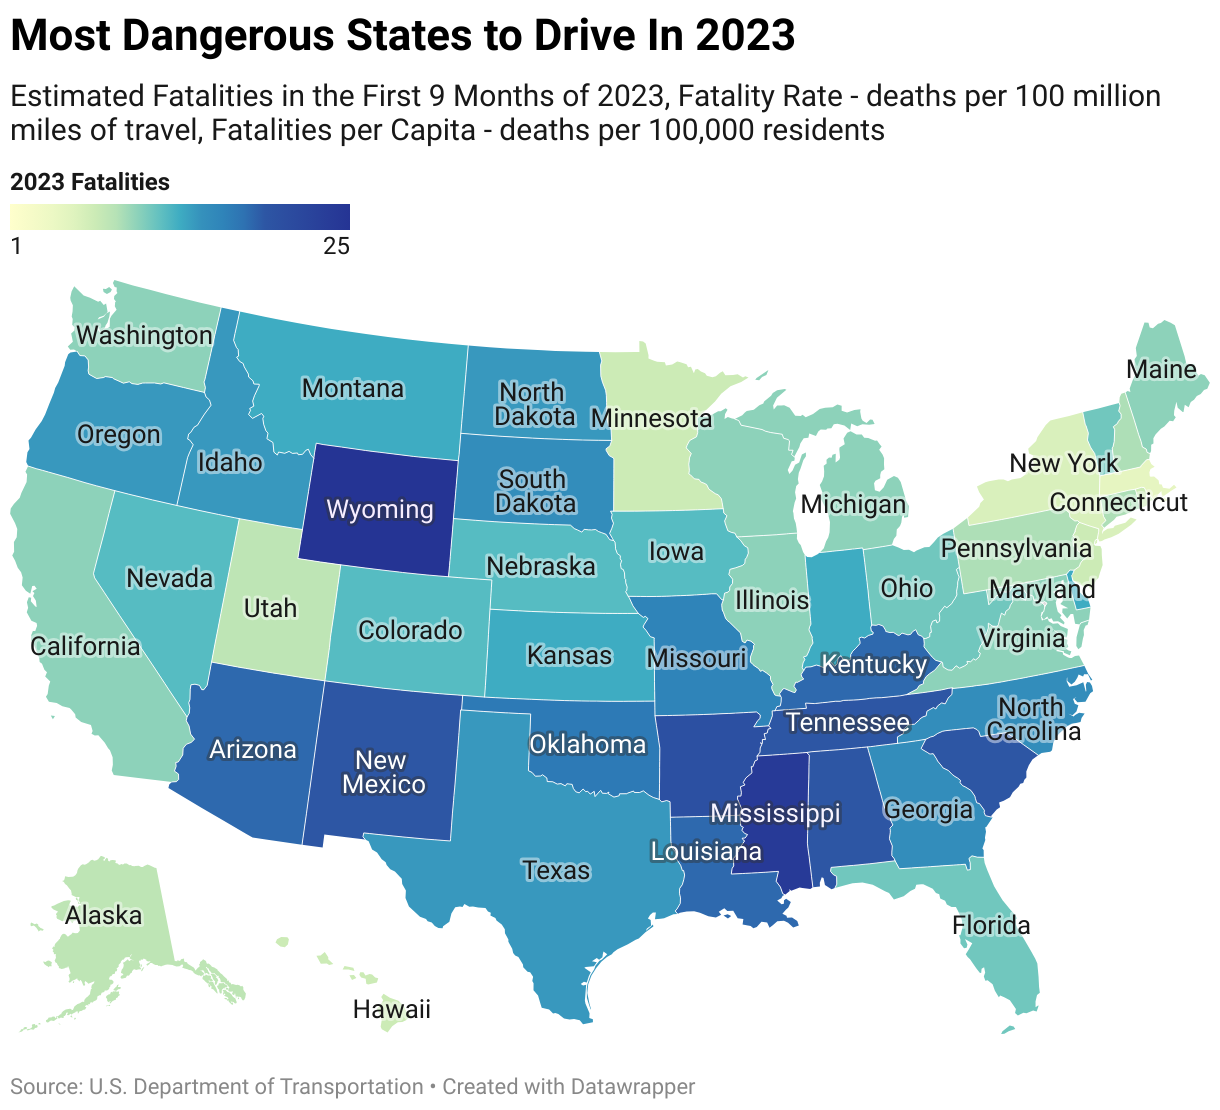
This color-coded map visually represents the per capita traffic fatality risk across the United States for 2023.

  • Lighter Shades: Represent areas with lower death rates, offering a glimpse into states where road safety measures may be more effective or fewer risks exist. 
  • Darker Shades: Indicate regions with higher death rates per 100,000 residents, drawing attention to potentially more dangerous areas for drivers and pedestrians alike.

The varying hues draw attention to regional patterns in road safety, with states like Texas and California prominently marked by their higher fatality rates.

Detailed State-by-State Fatality Analysis 

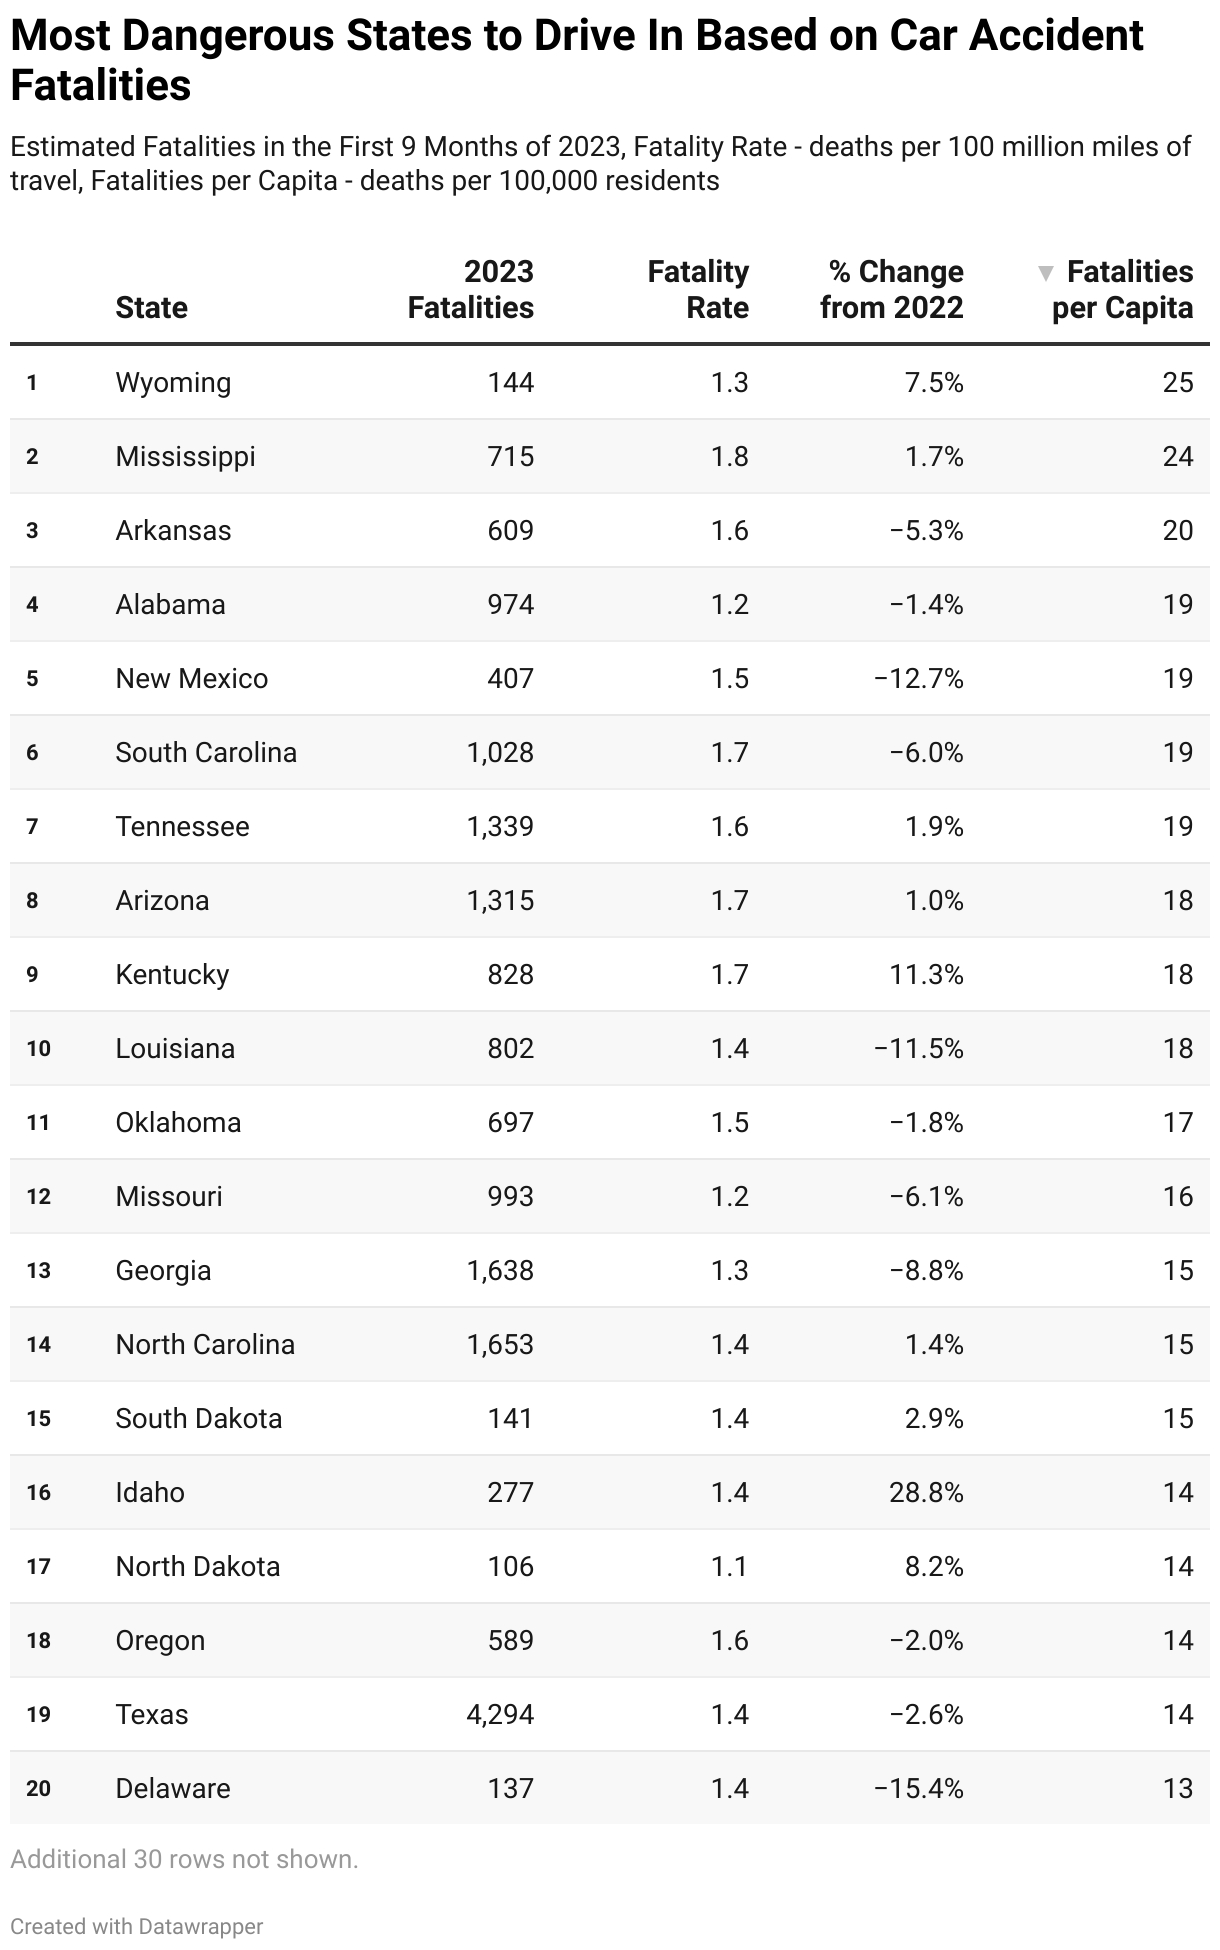
The table captures the stark realities of road safety. Through this analysis, we aim to provide a clearer picture of the trends and changes in road safety across the United States.

States with the Highest Fatalities

At the forefront of road safety concerns are Texas, California, and Florida, each marking a significant number of car accident fatalities.

Texas leads with the highest estimated fatalities, yet it’s important to note a slight decrease of 2% from the previous year. This trend suggests a cautious optimism but underscores the need for targeted safety measures.

California and Florida follow closely, reinforcing the necessity for continued vigilance and improvement in road safety protocols.

Notable Increases and Decreases

When examining changes in fatality rates, a mixed picture emerges.

Tennessee stands out with a worrying 3% increase, the highest among the states considered. This contrast is stark against the backdrop of significant improvements in Alaska and Vermont, which saw an 18% reduction in fatalities.

Vermont, in particular, boasts a slightly lower fatality rate, highlighting the effectiveness of its safety interventions. Conversely, Rhode Island experienced a dramatic 50% surge in fatalities, a reminder of the unpredictable nature of road safety challenges.

Per Capita Fatality Rates

The fatality rate per capita offers a nuanced perspective on road safety risks.

Tennessee’s rate of 14 fatalities per 100,000 residents points to a disproportionate risk for smaller populations. It suggests that even a few accidents can dramatically affect the state’s statistics.

Similarly, North Dakota’s increase to a per capita rate of 11.0 emphasizes the heightened danger in states with less dense populations.

This metric is a critical reminder that road safety strategies must be tailored to each state’s specific demographics and needs.

Success Stories and Improvements

The narrative of car accident fatalities isn’t solely grim.

Several states have demonstrated remarkable progress in enhancing road safety and reducing fatalities.

Hawaii’s Decrease in Fatalities

Hawaii stands out as a beacon of improvement. Having achieved a commendable 19% decrease in road fatalities in the first nine months of 2023 compared to the previous year.

This significant reduction is a testament to the state’s dedicated efforts in enforcing traffic laws, improving road infrastructure, and launching comprehensive public safety campaigns to educate drivers, cyclists, and pedestrians alike.

Hawaii’s success story underscores the potential impact of concerted road safety measures and community engagement in saving lives.

The Challenge in North Dakota

Conversely, North Dakota presents a complex case.

A 9% rise in road fatalities pushed its per capita rate to 11.0. This increase concerns states’ unique challenges with vast rural areas and lower population densities.

North Dakota’s situation highlights the ongoing need for targeted safety interventions, especially in rural settings, to combat the rise in fatalities.

It also points towards adapting road safety strategies to the state’s geographic and demographic contexts.

Safest Roads by State

The distinction for having the safest roads in the United States in 2023 belongs to a select group of states that have demonstrated significant improvements in road safety.

Among these, New Jersey stands out for its comprehensive approach to ensuring driver and passenger safety.

New Jersey’s Road Safety Leadership

New Jersey emerges as a beacon of road safety, showcasing a remarkable 17% drop in its fatality rate compared to the previous year.

This achievement can be attributed to:

  • Stringent regulations
  • Proactive safety campaigns
  • The state’s commitment to creating a safer driving environment

With this, four key factors contributing to New Jersey’s success include:

  1. High Seatbelt Usage
  2. Strict Regulations for New Drivers
  3. Public Safety Campaigns
  4. Investment in Road Infrastructure

Car Accidents by Time of Day

The dynamics of car accidents vary significantly throughout the week, with a notable escalation during the late-night hours of weekends.

Understanding these patterns is crucial for identifying potential risk factors and implementing effective safety measures.

Weekly Accident Patterns

A comprehensive analysis reveals a discernible pattern in the frequency of car accidents, with Saturdays marking the peak.

Approximately 17% of weekly car accidents occur on this day, underscoring its significance in traffic safety studies.

Sundays follow closely, accounting for about 15% of accidents, highlighting the weekend as a critical period for heightened road vigilance.

The contrast with the rest of the week is quite stark, where accident numbers are consistently lower. 

Time-Specific Accident Trends

The late-night window from midnight to 4 am on Saturdays is difficult for drivers.

Unlike the rest of the week, where accidents are more evenly distributed, this spike is distinct and merits special attention from drivers and policymakers alike.

Factors Contributing to Late-Night Weekend Accidents

The spike in car accidents during the late-night hours over weekends can be attributed to a combination of factors. These include:

  • Increased leisure activities
  • The prevalence of fatigued or impaired drivers
  • Challenges posed by night-time driving conditions

Accidents During Rush Hours vs. Non-Rush Hours

The patterns of car accidents to the time of day reveal intriguing insights into when drivers are most at risk. 

An examination of the available data highlights a counterintuitive trend. Most vehicular accidents do not occur during the bustling rush hours, as might be commonly presumed.

Non-Rush Hours

During the quieter periods of the day, specifically the night non-rush hours from 9 pm to 6 am, the roads witness the highest frequency of accidents.

With a staggering 15,600 incidents recorded, this period surprisingly emerges as the most hazardous.

Similarly, during the daytime non-rush hours, there was a significant number of accidents, totaling approximately 10,100 incidents.

These figures suggest that the less congested roads during non-rush hours might not necessarily be safer for motorists.

Rush Hours

In contrast, the expectedly hectic rush hours yield fewer accidents than might be anticipated, given the increased vehicular congestion.

Many drivers navigate their commute to work or school during the morning rush hour, which witnesses around 4,700 accidents, a figure notably lower than those recorded for non-rush periods.

Despite being busier than its morning counterpart, the evening rush hour still registers fewer accidents than night non-rush hours, with 8,700 incidents.

This discrepancy challenges the conventional wisdom that associates heavier traffic with a higher likelihood of accidents.

Factors Influencing Accident Rates

Several factors could be influencing the higher accident rates during non-rush hours.

  • Reduced visibility at night: This makes it more challenging for drivers to see other vehicles, pedestrians, and road hazards.
  • Driver fatigue: Individuals driving late at night may be tired or less alert.
  • Psychological aspect: Drivers may engage in riskier driving behaviors.
  • Alcohol consumption: It might also be more common during evening hours.

Accidents by Month or Season

The number of motor-vehicle deaths exhibits notable variances across different times of the year. It reveals patterns that coincide with seasonal changes and specific monthly activities.

Understanding these trends is crucial for identifying risky periods and implementing targeted safety measures.

There’s a distinct peak in motor-vehicle deaths around July, August, and October, with October being the deadliest with 4,482 fatalities, according to the National Safety Council.

Interestingly, there’s a noticeable dip in fatalities in February, the lowest of the year, before numbers climb through spring and into summer.

This seasonal trend suggests that the warmer months, often associated with more travel and vacationing, see higher numbers of road fatalities.

October’s spike could be attributed to various factors, such as changing weather conditions and the onset of darker evenings.

Meanwhile, February’s lower numbers might be related to less travel due to winter conditions or more cautious driving behavior due to adverse weather. 

Car Accidents by Age Group

The variance in car accident fatality rates across different age groups paints a vivid picture of the disparate risks faced by road users. 

A closer examination reveals a sobering reality, particularly for our youngest and most vulnerable populations.

Children and Teens

Children and teenagers, encompassing those aged 0 to 18, find themselves at the pinnacle of risk on the roads.

The statistics are particularly alarming, with a fatality rate of 74 deaths per 100,000 population.

This staggering figure not only underscores the vulnerability of this age group but also serves as a call for heightened awareness and protective measures.

This elevated risk is due to the combination of the following:

  • Inexperience
  • Susceptibility to distraction
  • Engaging in risky behaviors

Young Adults

As we move into the 19-25 age bracket, the risk of car accident fatalities begins to wane but remains worryingly high at 42 deaths per 100,000.

Often encouraged by newfound independence, this demographic still faces significant dangers.

Yet, the risk is palpable, demonstrating the need for ongoing education and safety initiatives for young drivers.

Mid-Adulthood

A noticeable decline in fatality rates is observed among those aged 26 to 34, where the rate drops to just 16 deaths per 100,000.

This reduction could be attributed to the following:

  • Driver experience
  • A better understanding of road safety
  • Less high risk driving

Adults Aged 35-54

For adults in the 35-54 age bracket, the car accident fatality rate increases to 24 deaths per 100,000 population. Several factors may contribute to this rise, such as:

  1. This age group often encompasses working adults who may have longer commutes and spend more time on the road.
  2. The pressures of professional and personal responsibilities can lead to distracted driving.
  3. This demographic might experience the beginning of age-related declines in reaction time or vision.

Seniors (65 and Over)

The risk remains elevated for seniors, with a fatality rate of 22 deaths per 100,000.

This age group contends with challenges that can notably affect driving capabilities.

  • Reaction times may slow with age.
  • Health issues could impair vision and decrease cognitive functioning.

Gender Comparisons in Traffic Accidents

Over the last twenty years, men have been significantly more likely to die in car crashes compared to women.

To see how many more men were likely fatalities in car accidents, we compared the number of men who died to the number of women. 

Male vs. Female Fatalities

In 2021 alone, the data shows that 30,747 men died in motor vehicle crashes.

It means that men are more than twice the number of women, at 12,051. This trend continues to be consistent with the pattern seen since 2001.

Furthermore, for every woman who died in a car crash, well over two men died.

This relationship works out to men being over 150% more likely to die in car accidents—a figure that highlights a serious gender gap in road safety. 

Vehicle-Type Fatality Comparisons

According to data gathered by the National Safety Council, the following paints a compelling picture of how crash fatality risks shift across different stages of life.

Pedestrian Collisions

Children between 0 and 4 years old are exceptionally vulnerable to the dangers of vehicular environments in the earliest stages of life.

Data from the National Safety Council reveals a startling reality: 37% of accident fatalities in this age group occur in pedestrian settings.

This significant percentage highlights a critical safety concern for our youngest pedestrians.

Multi-Vehicle Crashes

For adults between 25 and 54, the journey through life’s prime years is shadowed by significant risk from the roads they travel on.

This age group is active in both their professional and personal lives, so it is pronouncedly threatened by multi-vehicle or vehicle-on-vehicle crashes.

The data sheds light on a sobering fact: an overwhelming 91% of traffic-related fatalities among adults aged 25 to 44 result from these harrowing incidents.

This statistic not only underscores the acute vulnerability of this demographic to such tragedies but also highlights the urgent need for interventions.

Fixed Object Collisions

As individuals enter their later years, the nature of vehicular accident risks begins to shift notably.

Among older adults, mainly those aged 65 to 74, there’s a marked increase in fatalities arising from collisions with fixed objects.

The data suggests a fact for this age group: 41% of their vehicular accident fatalities occur in scenarios where a vehicle collides with a stationary object.

This significant proportion highlights a distinct trend towards such types of accidents among older adults. 

Accidents Involving Commercial vs. Personal Vehicles

Passenger vehicles and trucks are almost equally involved in fatal accidents, with over 20,000 reported incidents each.

Motorcycles also show a considerable number of fatal crashes, amounting to 5,715.

Alcohol-Impaired Related Accidents

Every day, alcohol-impaired driving accidents have a profound impact on communities across the United States. 

Fatal Statistics

According to the U.S. Department of Transportation, these tragic incidents claim approximately 37 lives daily.

This distressing statistic equates to one life lost every 39 minutes.

The year 2021 marked a bleak milestone, with 13,384 individuals dying from such accidents—a staggering 14% increase from the previous year.

Trends in Alcohol-Impaired Driving

While the rates of self-reported alcohol-impaired driving have fluctuated over the years, with a noticeable peak in 2016, the underlying issue remains constant.

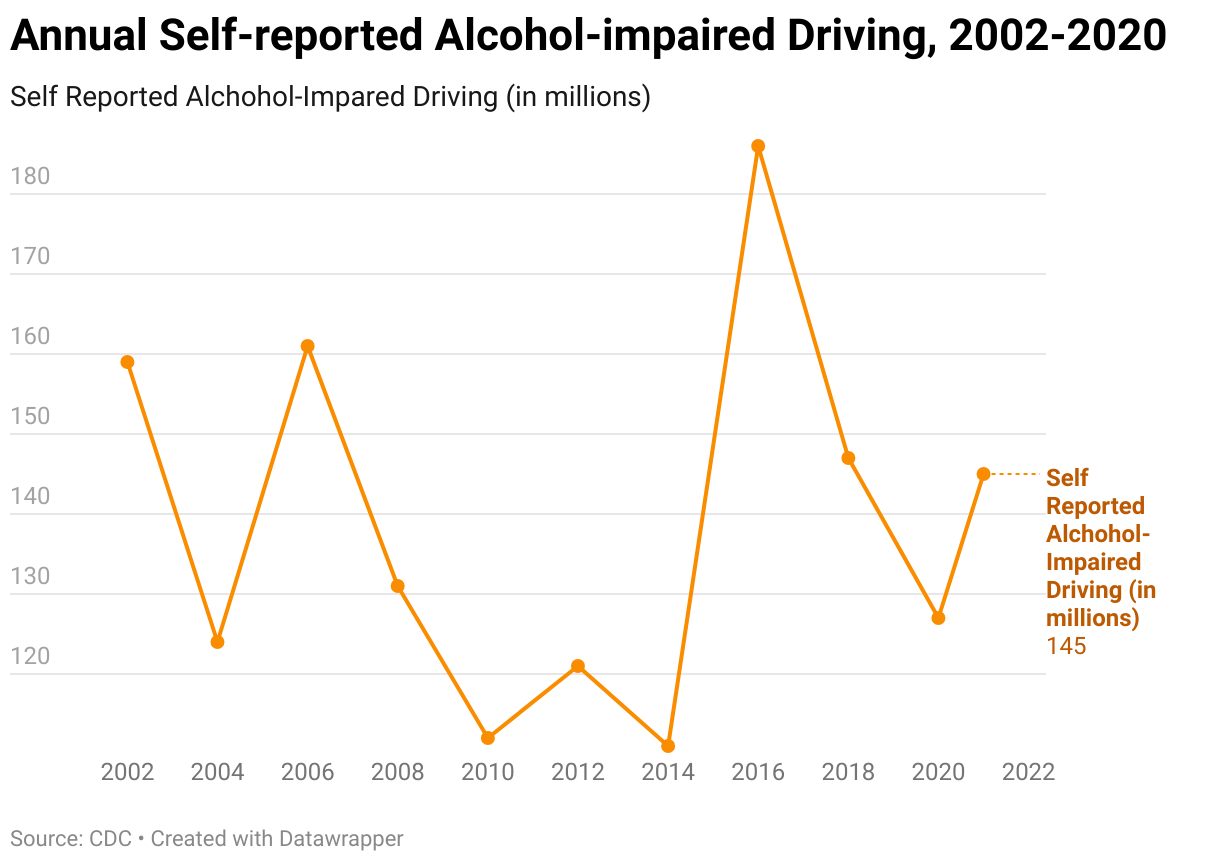
Despite varying degrees of public awareness and enforcement intensity, the number of incidents and fatalities has shown that much more needs to be done to combat this issue effectively.

The enduring fact is that alcohol-impaired driving accidents—and the devastating loss of life they cause—are entirely preventable.

Yet, they continue to occur with alarming regularity, underscoring the need for continued education, enforcement, and personal responsibility.

Legal and Preventive Measures

Driving while impaired by alcohol is not only dangerous; it’s a serious offense met with stringent penalties designed to deter such behavior. 

Enforcement and Penalties

Since the 1980s, strict enforcement of drunk-driving laws has played a crucial role in reducing related fatalities. Offenders face severe consequences, ranging from fines to jail time.

For first-time offenders, the financial repercussions alone can exceed $10,000, highlighting the significant personal and societal costs of impaired driving.

Ignition Interlock Devices

Many states have mandated the use of ignition interlock devices to prevent alcohol-impaired driving further.

These devices are installed at the driver’s expense. It prevents a vehicle from operating if the driver’s blood alcohol content (BAC) exceeds a preset limit, typically 0.02 g/dL. 

Speeding Related Accidents

In 2021, speed was a factor in nearly a third of all traffic fatalities, with over 12,000 lives lost to speed-related crashes.​

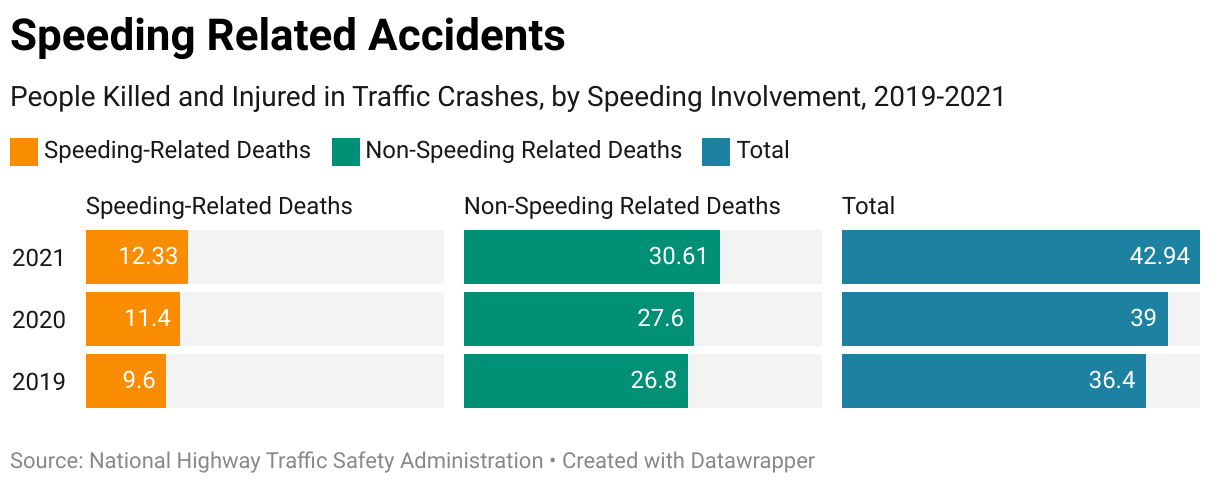
Here’s what the data tells us: 

  • In 2019, approximately 26.37% of traffic deaths were related to speeding.
  • In 2020, about 29.23% of traffic deaths were related to speeding.
  • In 2021, around 28.71% of traffic deaths were related to speeding. ​

Higher speed limits only exacerbate the issue. It invites drivers to push the pedal further, increasing the likelihood of dangerous or fatal outcomes. 

As a result, the danger of speeding is twofold:

  1. It reduces the time drivers have to react.
  2. It multiplies the severity of accidents due to higher crash energy.

Conclusion

At Uplift Legal Funding, we understand the profound impact of road accidents on individuals and families.

As we navigate the complexities of road safety, our commitment to advocating for change and supporting those affected remains unwavering.

Through our pre-settlement loans, we uphold our dedication to supporting families during challenging times.

We stand ready to assist those in need and contribute to building a safer tomorrow on our roads.

Scroll to Top
Call Now Button